How to read your energy bill
Part 1
Your billing rates
Electricity is part of all of our lives, so it’s so important to understand your energy bill! Whilst they can sometimes seem complicated, once you know what to look for and how to interpret some of the technical lingo, it’s much easier to understand. And now on the back of increased electricity rates (between 19.6 and 23.9% in 2023), we are all looking for the best ways to save money on energy.
In this guide, we’ll walk you through the key elements of your Energy bill, so you can read it and feel confident you know exactly what you’re paying for.
Take a look at the images below. The images show that the average daily usage from February to May was 18.95kW (refer to image 1), while from May to August, it increased to 39.67kW (refer to image 2), indicating an increase of 20.752kW per day. This increase is not uncommon during the winter months, given that it stays darker for longer, leading to more use of lights, and the colder weather prompts higher usage of heaters. Consequently, more energy is consumed, resulting in an increase in the energy bill. The average cost per day for warmer months is $8.57, compared to $18.76 in colder months.
As you can see on the right side of the images, they display the average energy usage per day, per person in your area. Remember that this is just an estimate, and the actual usage depends on numerous factors. However it is a good figure to compare your usage to, particularly to see if you can cut down on your energy usage.
Your bill will also conveniently show you how much of an increase or decrease there has been in your usage compared to the same time last year. This is another great metric to see if you can cut down your usage.
(image 1) – Feb – May

(image 2) – May to August

Part 2
Solar Feed-in Credit
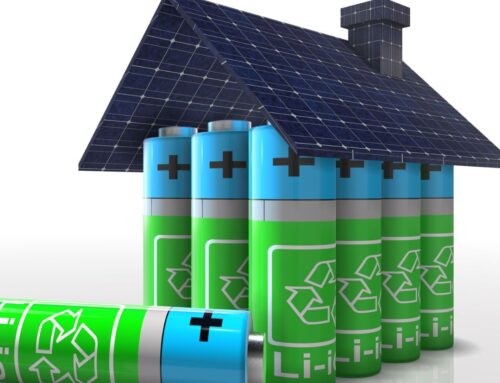
Now, let’s move on to take a look at the ‘Total Solar Feed-in Credit,’ which is higher in February to May. This is not uncommon because the days are longer and sunnier during these months. Consequently, your solar panels will generate more energy, covering a significant portion of your energy needs during the warmer months. This reliance on solar power instead of the grid is excellent news because it can result in substantial cost savings.
On the other hand, during the colder months, when the days are shorter and less sunny, your solar panels won’t generate as much energy as they do in the warmer months. Therefore, it’s not surprising to see lower solar feed-in credits in May to August (the winter months). Depending on the time of the year, your solar feed-in credit will vary.
It’s important to be mindful that you will export less solar power to the grid when you are consuming more through your load (home) using larger appliances such as washing machines, dryers, spa/pool pumps, etc.
Part 3
The Break Down of Charges.
The first thing to look at is ‘Charge (inclusive of GST)’ – which is highlighted below in blue. The top screenshot is Feb-May. The bottom screenshot is May – Aug.
(Feb-May)

The first thing that you notice for May – Aug is for the first 51 days your charges are the same as Feb-May and then for 41 days your charges have increased (assuming from 1st July).
(May – Aug)

For May – Aug you have used less power for less days, but your charge is almost $40 more.


The next thing we look at is Solar Credit.
1577.836 (Export kWh) divided by 89 (days of the bill) equals 17.728 (solar energy generated per day)

688.162 (Export kWh) divided by 92 (days of the bill) equals 7.48 (solar generated per day)

There is a significant difference between the two numbers 1577.836 kWh and 688.162 kWh, this is due to the time of the year. Feb – May will have longer and sunnier days (with less electricity from the grid used) with May – Aug having shorter sunnier days with significantly poorer weather and that is why electricity will be used.
Part 2 will also show you when your peak, off peak and shoulder times are. Shoulder times are considered to be times when electricity costs a bit less than peak.

By understanding these times, you can choose when to do household chores that require electricity, i.e. the washing or using the dishwasher.
In addition, we would also recommend looking around for other electricity providers and see what their rates are.
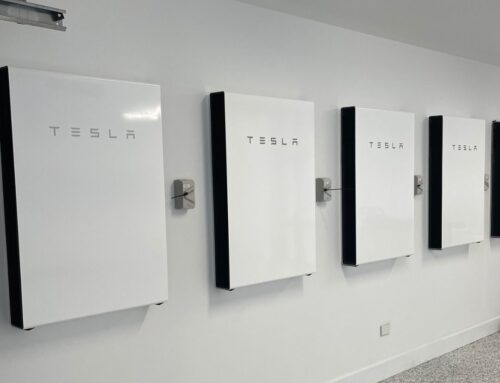
These are a few services at Kozco Energy Group that can help keep your solar system and battery working well for years to come.
- System Health Check – This service is $199 and will include a full solar system service where our expert technicians will check if panels and inverter are operational.
- System Health Check + Panel Clean– This service is $149 for the full system health check as per above + 10 per panel for single storey building or 12.50 per double storey building.
For more expert advice and information, feel free to contact the Kozco Energy Group team by calling us on 1300 456 926.